

Cities That Travel the Furthest for the Holidays
The winter holiday season is usually a time of family, fun, and tradition for Americans. But COVID-19 put a damper on 2020, and holiday celebrations were no exception. Millions of people suspended vacation plans throughout the year as the virus upended travel. The winter season brought a new frightening surge of coronavirus cases and caused areas to tighten restrictions even further.
Even without legal mandates to halt traveling, many people were hesitant to potentially expose their family members to the virus. As a result, more people stayed put than ever this past year. One study conducted by the American Hotel and Lodging Association found 72% of Americans stated that they were unlikely to travel for Thanksgiving, and 69% were unlikely to travel for Christmas. According to TSA checkpoint data, while millions of travelers passed through U.S. airports in the final weeks of 2020, total throughput was more than 50% lower than in 2019.
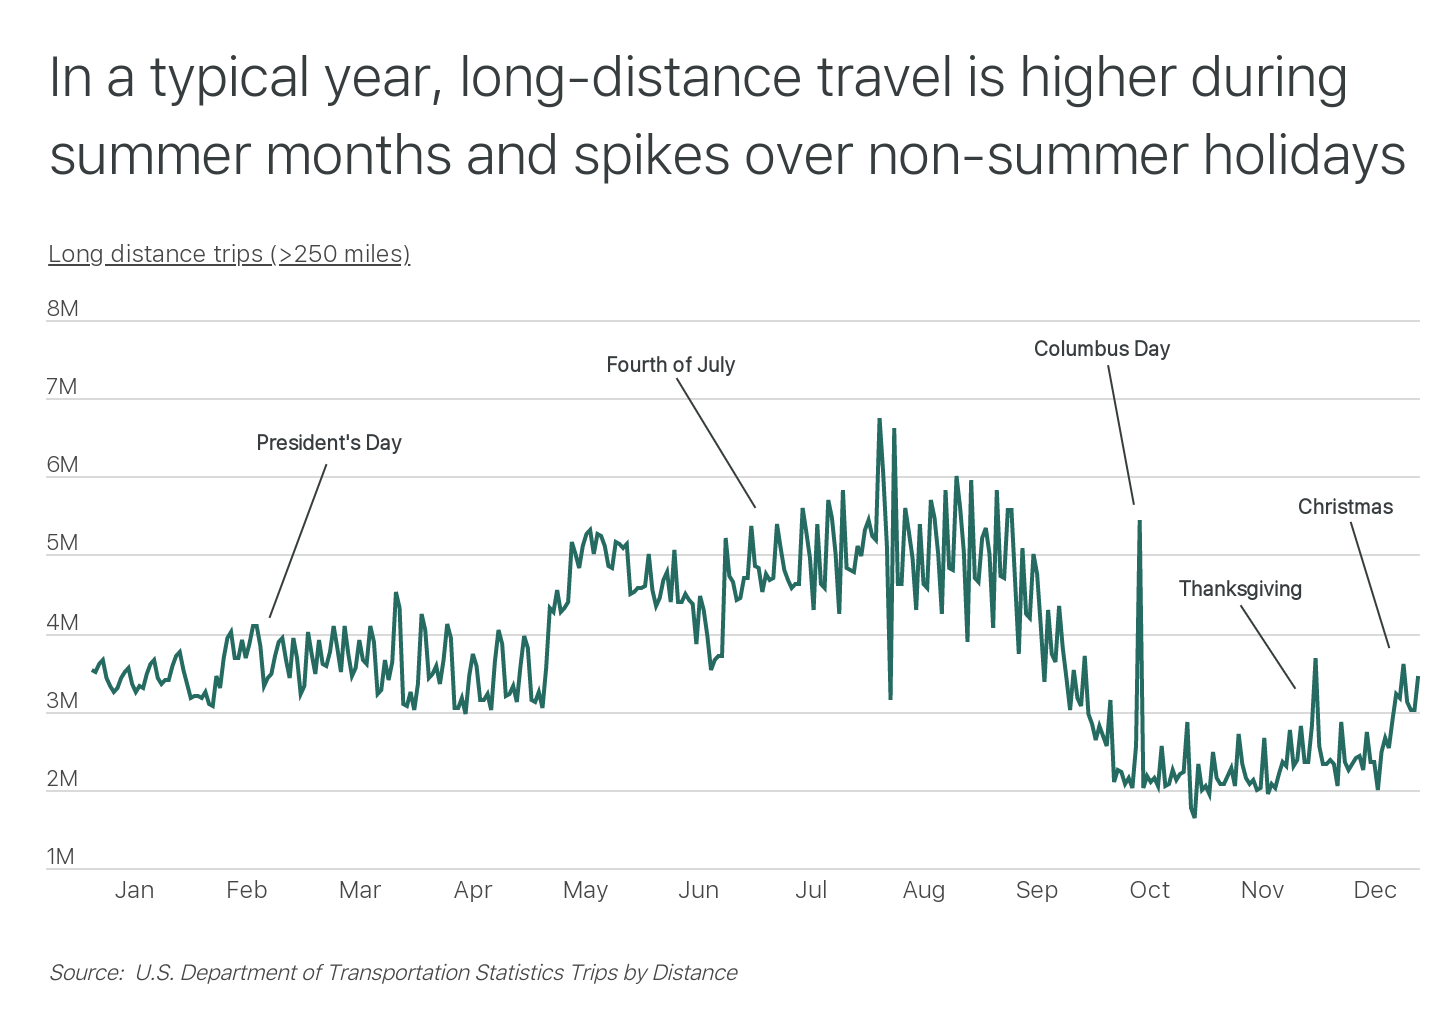
Late spring through summer has always been a popular time for travel. Between summer break for schools, good weather, and lighter workloads, many people decide to leave home for relaxation and adventure, flocking to airports, campgrounds, and RV parks.
Once fall sets in, and school gets back in session, traveling typically calms down to its lowest levels. However, holidays have long been the exception to the rule. Long-distance trips usually spike around any non-summer holiday. During the 2019 Christmas-New Years holiday, long distance trips—those greater than 250 miles—rose by 16.7 percent compared to the two weeks prior.
The newest COVID-19 travel guidelines have had a larger impact on some areas than others. While traveling during the summer months is typically spread across most areas, winter holiday travel is most common for those who live in warmer states.
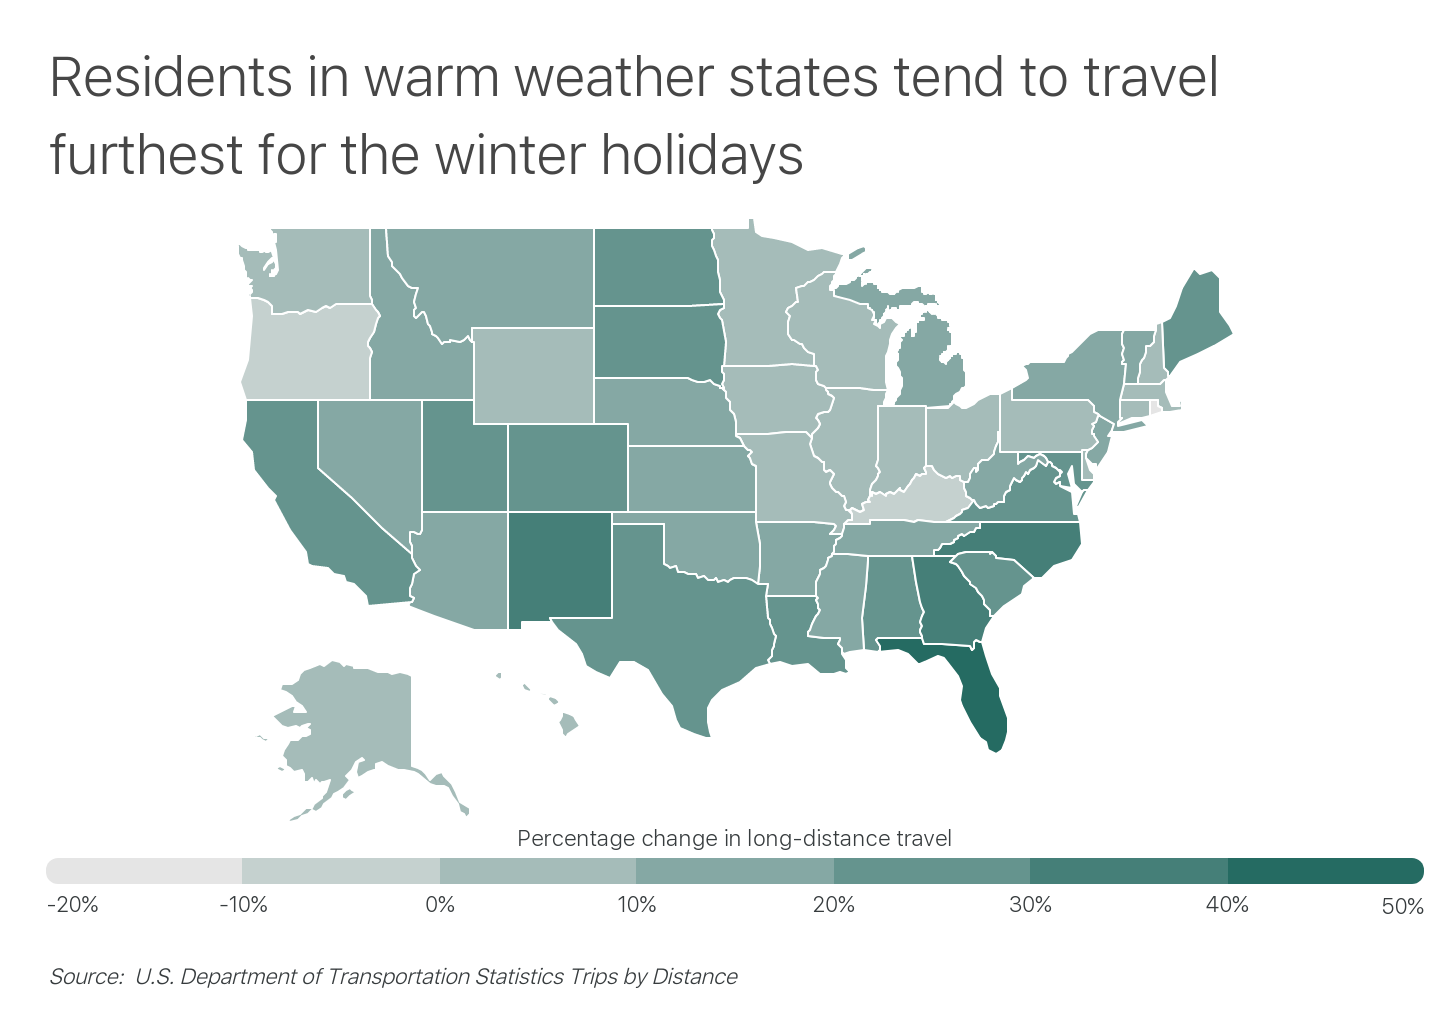
To see which areas were most affected by COVID-19 travel restrictions, researchers at Outdoorsy performed an analysis to see which large metro areas travel the furthest for the winter holidays during a typical year. Researchers used data from the U.S. Department of Transportation Statistics Trips by Distance to calculate the percentage change in trips over 250 miles during 12/20/19-1/2/20 with the two weeks prior. Researchers also calculated the number of long-distance trips taken per capita in each of these two-week periods. To ensure that the analysis is as relevant as possible, only areas with at least 100,000 residents were included.
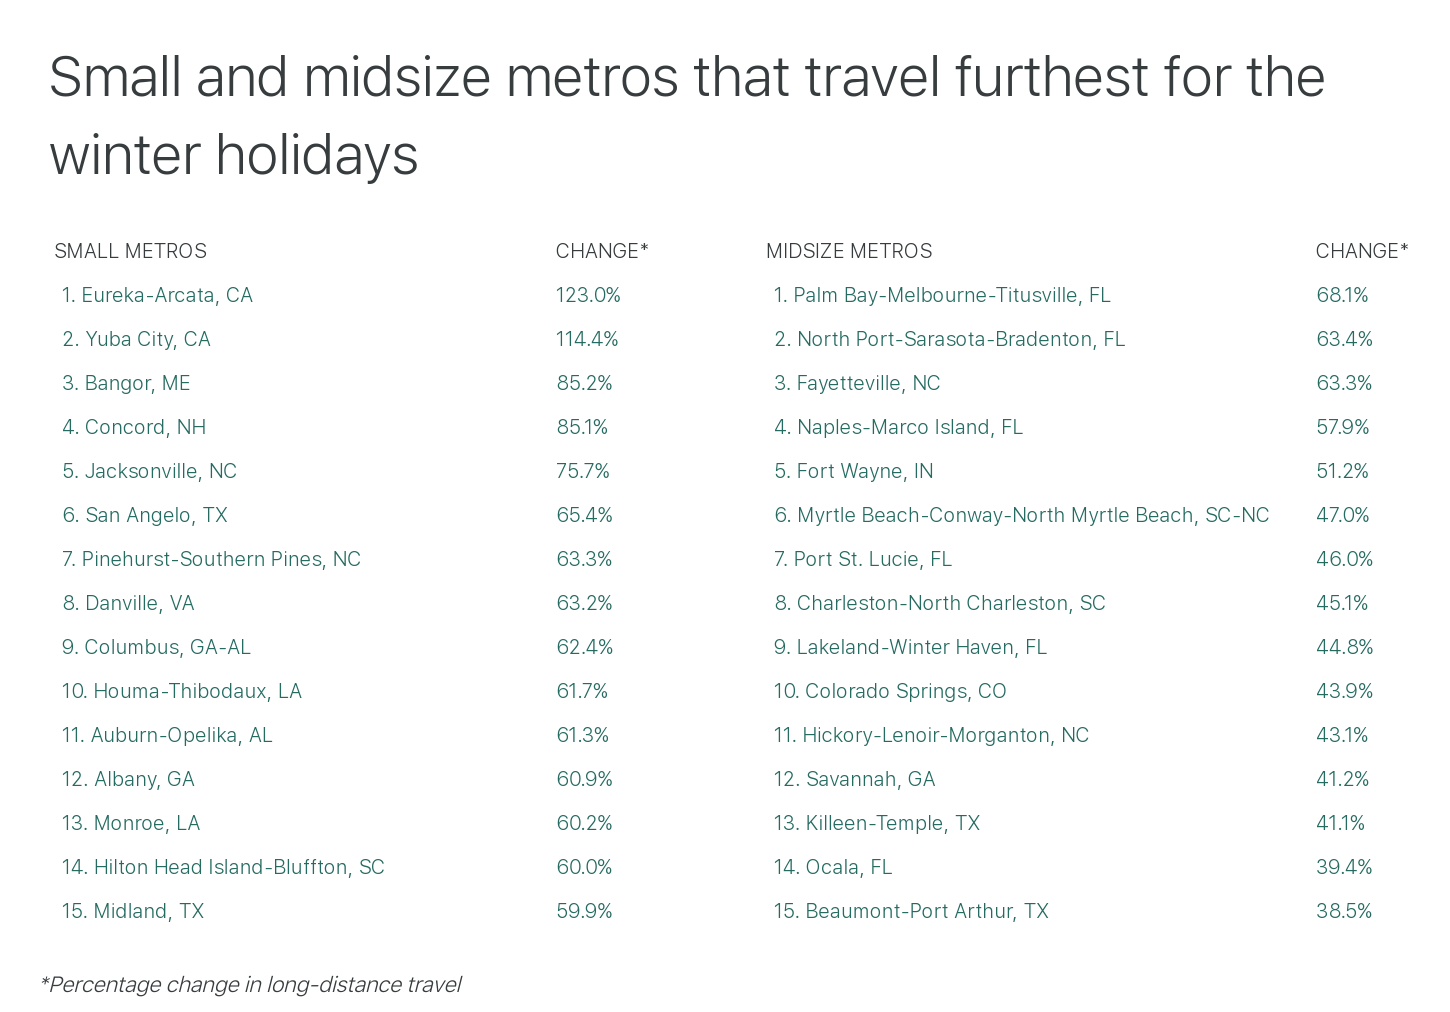
Here are the metropolitan areas that travel furthest for the winter holidays:
Large Metros That Travel Furthest for the Winter Holidays

Photo Credit: Alamy Stock Photo
15. Los Angeles-Long Beach-Anaheim, CA
- Percentage change in long-distance travel: 29.6%
- Long-distance trips during the holidays (per 1k population): 95.0
- Long-distance trips prior to the holidays (per 1k population): 73.3
- Population: 13,214,799
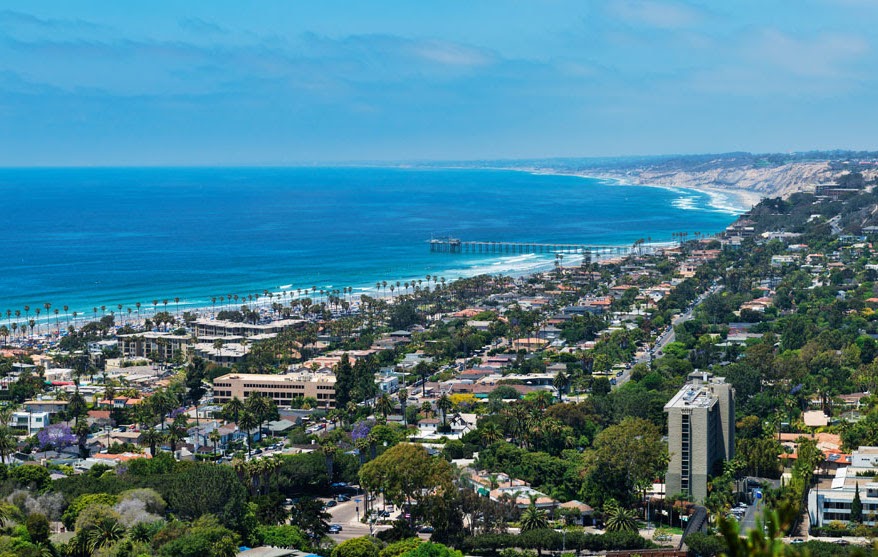
Photo Credit: Alamy Stock Photo
14. San Diego-Chula Vista-Carlsbad, CA
- Percentage change in long-distance travel: 31.7%
- Long-distance trips during the holidays (per 1k population): 141.4
- Long-distance trips prior to the holidays (per 1k population): 107.4
- Population: 3,338,330

Photo Credit: Alamy Stock Photo
13. New Orleans-Metairie, LA
- Percentage change in long-distance travel: 33.1%
- Long-distance trips during the holidays (per 1k population): 71.7
- Long-distance trips prior to the holidays (per 1k population): 53.9
- Population: 1,270,530

Photo Credit: Alamy Stock Photo
12. Charlotte-Concord-Gastonia, NC-SC
- Percentage change in long-distance travel: 33.1%
- Long-distance trips during the holidays (per 1k population): 143.2
- Long-distance trips prior to the holidays (per 1k population): 107.6
- Population: 2,636,883

Photo Credit: Alamy Stock Photo
11. Washington-Arlington-Alexandria, DC-VA-MD-WV
- Percentage change in long-distance travel: 33.1%
- Long-distance trips during the holidays (per 1k population): 175.8
- Long-distance trips prior to the holidays (per 1k population): 132.1
- Population: 6,280,697

Photo Credit: Alamy Stock Photo
10. Atlanta-Sandy Springs-Alpharetta, GA
- Percentage change in long-distance travel: 33.4%
- Long-distance trips during the holidays (per 1k population): 208.3
- Long-distance trips prior to the holidays (per 1k population): 156.1
- Population: 6,018,744
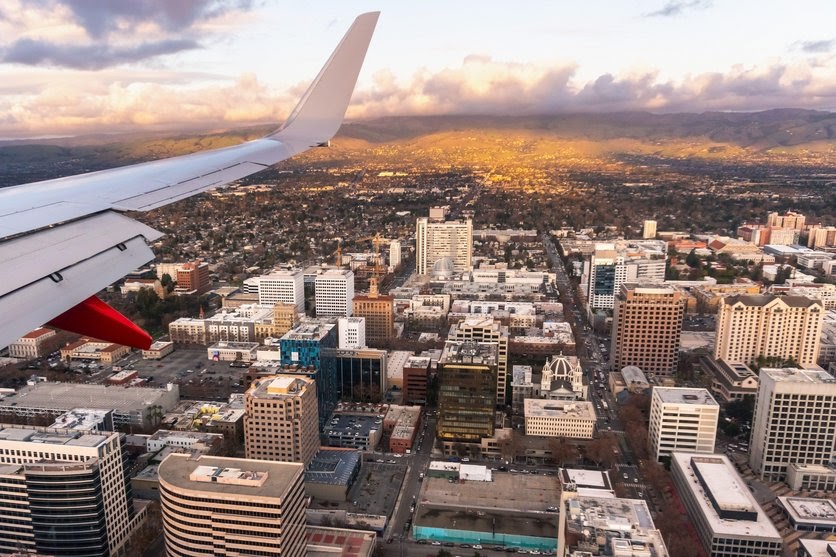
Photo Credit: Alamy Stock Photo
9. San Jose-Sunnyvale-Santa Clara, CA
- Percentage change in long-distance travel: 33.5%
- Long-distance trips during the holidays (per 1k population): 79.2
- Long-distance trips prior to the holidays (per 1k population): 59.3
- Population: 1,990,660

Photo Credit: Alamy Stock Photo
8. Tampa-St. Petersburg-Clearwater, FL
- Percentage change in long-distance travel: 33.9%
- Long-distance trips during the holidays (per 1k population): 95.2
- Long-distance trips prior to the holidays (per 1k population): 71.1
- Population: 3,194,831
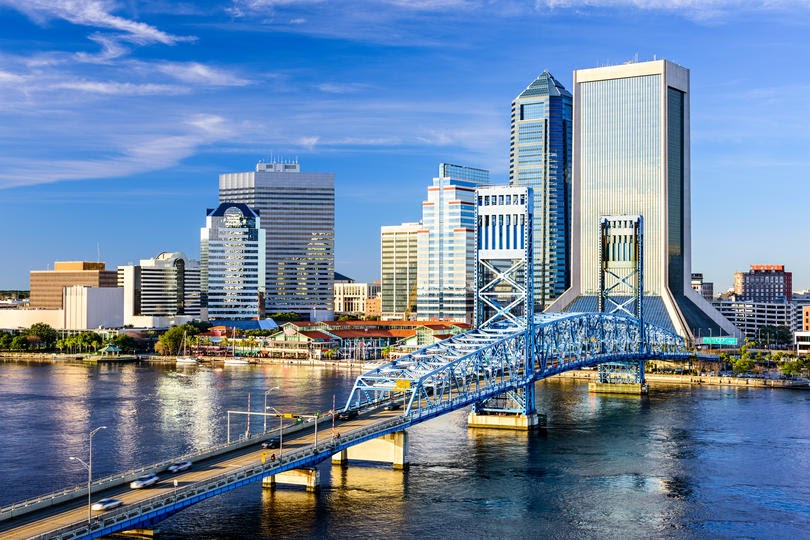
Photo Credit: Alamy Stock Photo
7. Jacksonville, FL
- Percentage change in long-distance travel: 34.8%
- Long-distance trips during the holidays (per 1k population): 175.2
- Long-distance trips prior to the holidays (per 1k population): 129.9
- Population: 1,559,514

Photo Credit: Alamy Stock Photo
6. Virginia Beach-Norfolk-Newport News, VA-NC
- Percentage change in long-distance travel: 35.2%
- Long-distance trips during the holidays (per 1k population): 98.5
- Long-distance trips prior to the holidays (per 1k population): 72.8
- Population: 1,765,031

Photo Credit: Alamy Stock Photo
5. Houston-The Woodlands-Sugar Land, TX
- Percentage change in long-distance travel: 36.5%
- Long-distance trips during the holidays (per 1k population): 117.5
- Long-distance trips prior to the holidays (per 1k population): 86.0
- Population: 7,066,140

Photo Credit: Alamy Stock Photo
4. San Francisco-Oakland-Berkeley, CA
- Percentage change in long-distance travel: 41.0%
- Long-distance trips during the holidays (per 1k population): 114.2
- Long-distance trips prior to the holidays (per 1k population): 81.0
- Population: 4,731,803
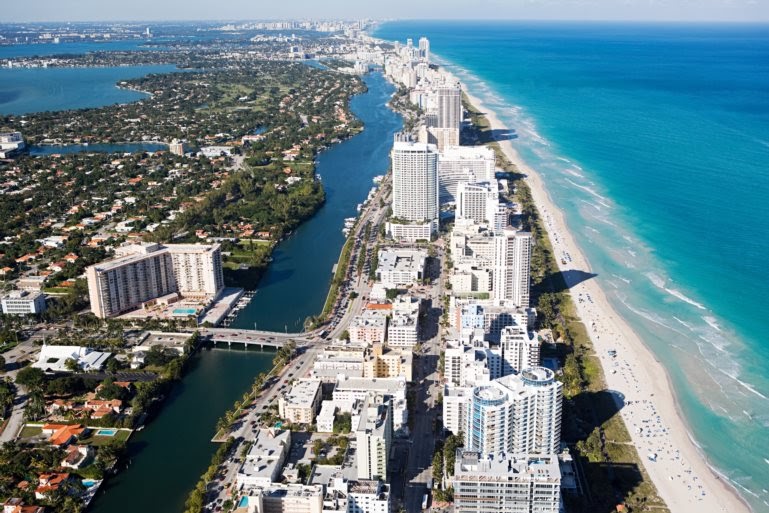
Photo Credit: Alamy Stock Photo
3. Miami-Fort Lauderdale-Pompano Beach, FL
- Percentage change in long-distance travel: 43.6%
- Long-distance trips during the holidays (per 1k population): 123.0
- Long-distance trips prior to the holidays (per 1k population): 85.7
- Population: 6,166,488
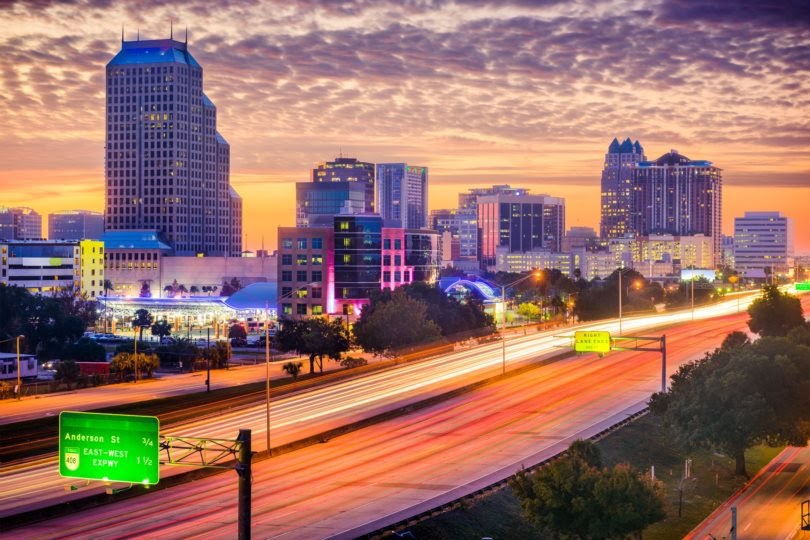
Photo Credit: Alamy Stock Photo
2. Orlando-Kissimmee-Sanford, FL
- Percentage change in long-distance travel: 51.1%
- Long-distance trips during the holidays (per 1k population): 121.8
- Long-distance trips prior to the holidays (per 1k population): 80.6
- Population: 2,608,147
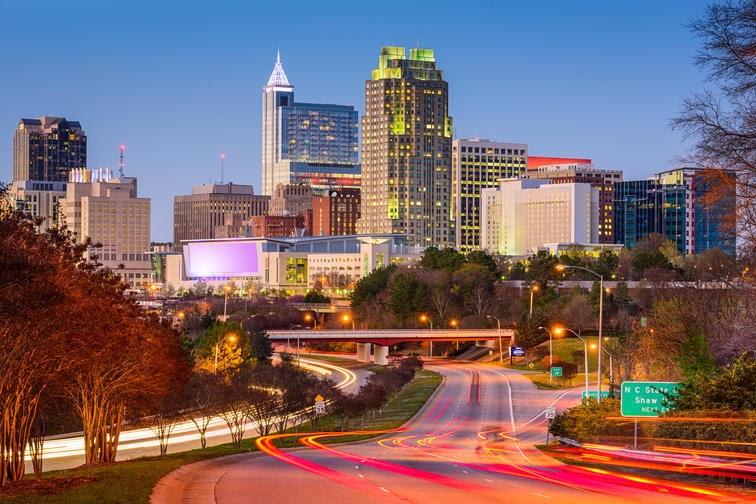
Photo Credit: Alamy Stock Photo
1. Raleigh-Cary, NC
- Percentage change in long-distance travel: 53.4%
- Long-distance trips during the holidays (per 1k population): 91.2
- Long-distance trips prior to the holidays (per 1k population): 59.5
- Population: 1,390,785
Methodology & Detailed Findings
The data used in this analysis is from the U.S. Department of Transportation Statistics Trips by Distancedataset. To determine the locations that travel furthest during the winter holidays, researchers calculated the percentage change in long-distance trips (defined as trips greater than 250 miles) comparing the two-week period 12/20/19–1/2/20 with the two weeks prior. Researchers also calculated the number of long-distance trips taken per capita in each of those two-week periods. To improve relevance, only metropolitan areas with at least 100,000 residents were included. Additionally, metros were grouped into cohorts based on population: small (100,000–349,999), midsize (350,000–999,999), and large (1,000,000 or more).
This article was first published on LatticePublishing.com.